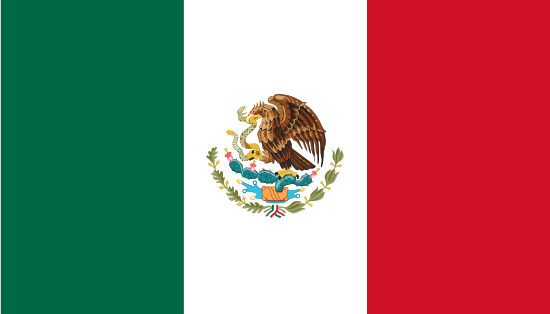
México

  • Presidente:Claudia Sheinbaum
  • Presidente do Senado:Gerardo Fernández Noroña
  • Capital:Mexico City (Distrito Federal)
  • Línguas:Spanish only 92.7%, Spanish and indigenous languages 5.7%, indigenous only 0.8%, unspecified 0.8% note: indigenous languages include various Mayan, Nahuatl, and other regional languages (2005)
  • Governo
  • Estatísticas Nacionais Oficias
  • População, pessoas:131.413.615 (2025)
  • Área, km2:1.943.950
  • PIB per capita, US$:13.790 (2023)
  • PIB, bilhões em US$ atuais:1.789,1 (2023)
  • Índice de GINI:43,5 (2022)
  • Facilidade para Fazer Negócios:60

Todos os conjuntos de dados: 2 G
  • 2
    • junho 2016
      Fonte: Deloitte
      Carregamento por: Knoema
      Acesso em 02 junho, 2016
      Selecionar Conjunto de dados
      With the release of the 2016 Global Manufacturing Competitiveness Index (GMCI), Deloitte Touche Tohmatsu Limited (Deloitte Global) and the Council on Competitiveness (the Council) in the US build upon the GMCI research, with prior studies published in 2010 and 2013. The results of the 2016 study clearly show the ongoing influence manufacturing has on driving global economies. From its influence on infrastructure development, job creation, and contribution to gross domestic product (GDP) on both an overall and per capita basis, a strong manufacturing sector creates a clear path toward economic prosperity.
  • G
    • dezembro 2020
      Fonte: World Economic Forum
      Carregamento por: Knoema
      Acesso em 28 dezembro, 2020
      Selecionar Conjunto de dados
      Data cited at: The World Economic Forum https://www.weforum.org/ Topic: The Global Competitiveness Report Publication URL: https://www.weforum.org/reports/the-global-competitiveness-report-2020 License: https://creativecommons.org/licenses/by-nc-nd/4.0/legalcode
    • dezembro 2024
      Fonte: SolAbility
      Carregamento por: Knoema
      Acesso em 24 dezembro, 2024
      Selecionar Conjunto de dados
      Highlights of the  Global Sustainable Competitiveness Report 2024:The GSCI is now based on a new calculation methodology incorporating 216 quantitative indicators that uses (but is not based upon) AI tools to clean data, and analyse trends and correlations • Scandinavia continues to make its mark on the Sustainable Competitiveness Index: of the top 5 spots, 4 are Scandinavian. Sweden keeps topping the Index, followed by Finland and Denmark; • Northern European countries dominate the top 20 rankings; • Only two countries in the Top 20 are not European: Japan on 10, and South on 16; • China is ranked 28, exceling in Intellectual Capital but lags in Natural Capital and Resource Efficiency, albeit with encouraging signs of efficiency improvements; • The USA is ranked 35, performing comparatively poor in resource efficiency and social capital, reflecting a decline that could potentially undermine the global status of the US in the future; • Germany ranks 9, France 8, and the UK 14; • Brazil ranks 52, India 90, and Nigeria – Africa’s most populous nation – 145; • Some of the least developed nations have a considerable higher GSCI ranking than their GDP would suggest (e.g. Vietnam, Colombia, Peu, Nepal, Bhutan, Bolivia, …) • Asian nations (South Korea, Japan, Singapore, and China) lead the Intellectual Capital Index – the basis of innovation. • The Social Capital Index ranking is headed by Northern European (Scandinavian) countries, the result of economic growth combined with a commonly accepted social consensus • Countries savaged by violent conflicts (Sudan, Yemen, Eritrea, Libya, Somalia, Afghanistan) are at the bottom of the GSCI